ORIX Monitor
System telemetry that says where each number comes from
Development build
Overview
ORIX Monitor is a native macOS system monitor: CPU, GPU, memory, disks, network, power, thermal state and processes, sampled on a schedule and kept in a local history. It is in development; nothing has been released.
Its guiding rule is to show only what macOS actually exposes. Every metric carries a quality label, such as measured, derived, estimate or best effort, and sensors that macOS does not publish through supported interfaces are listed as unavailable instead of being guessed.
The telemetry core is a separate Swift package with its own tests. The app on top of it has a customisable overview, detail pages per subsystem, a process explorer, stored history, findings, alerts, a report builder and a menu bar extra. A French-Canadian interface is being built: the string catalogue is English only today.
Key features
- 01
Collectors for every subsystem
CPU load per core, memory accounting and pressure, swap, volumes and disk I/O, network interfaces, power and battery, thermal state and GPU devices are read by dedicated collectors in the core package.
- 02
A quality label on every metric
A metric catalogue records the source and method of each stored value, and the interface shows whether it is measured, derived, an estimate or best effort.
- 03
Unavailable sensors are declared
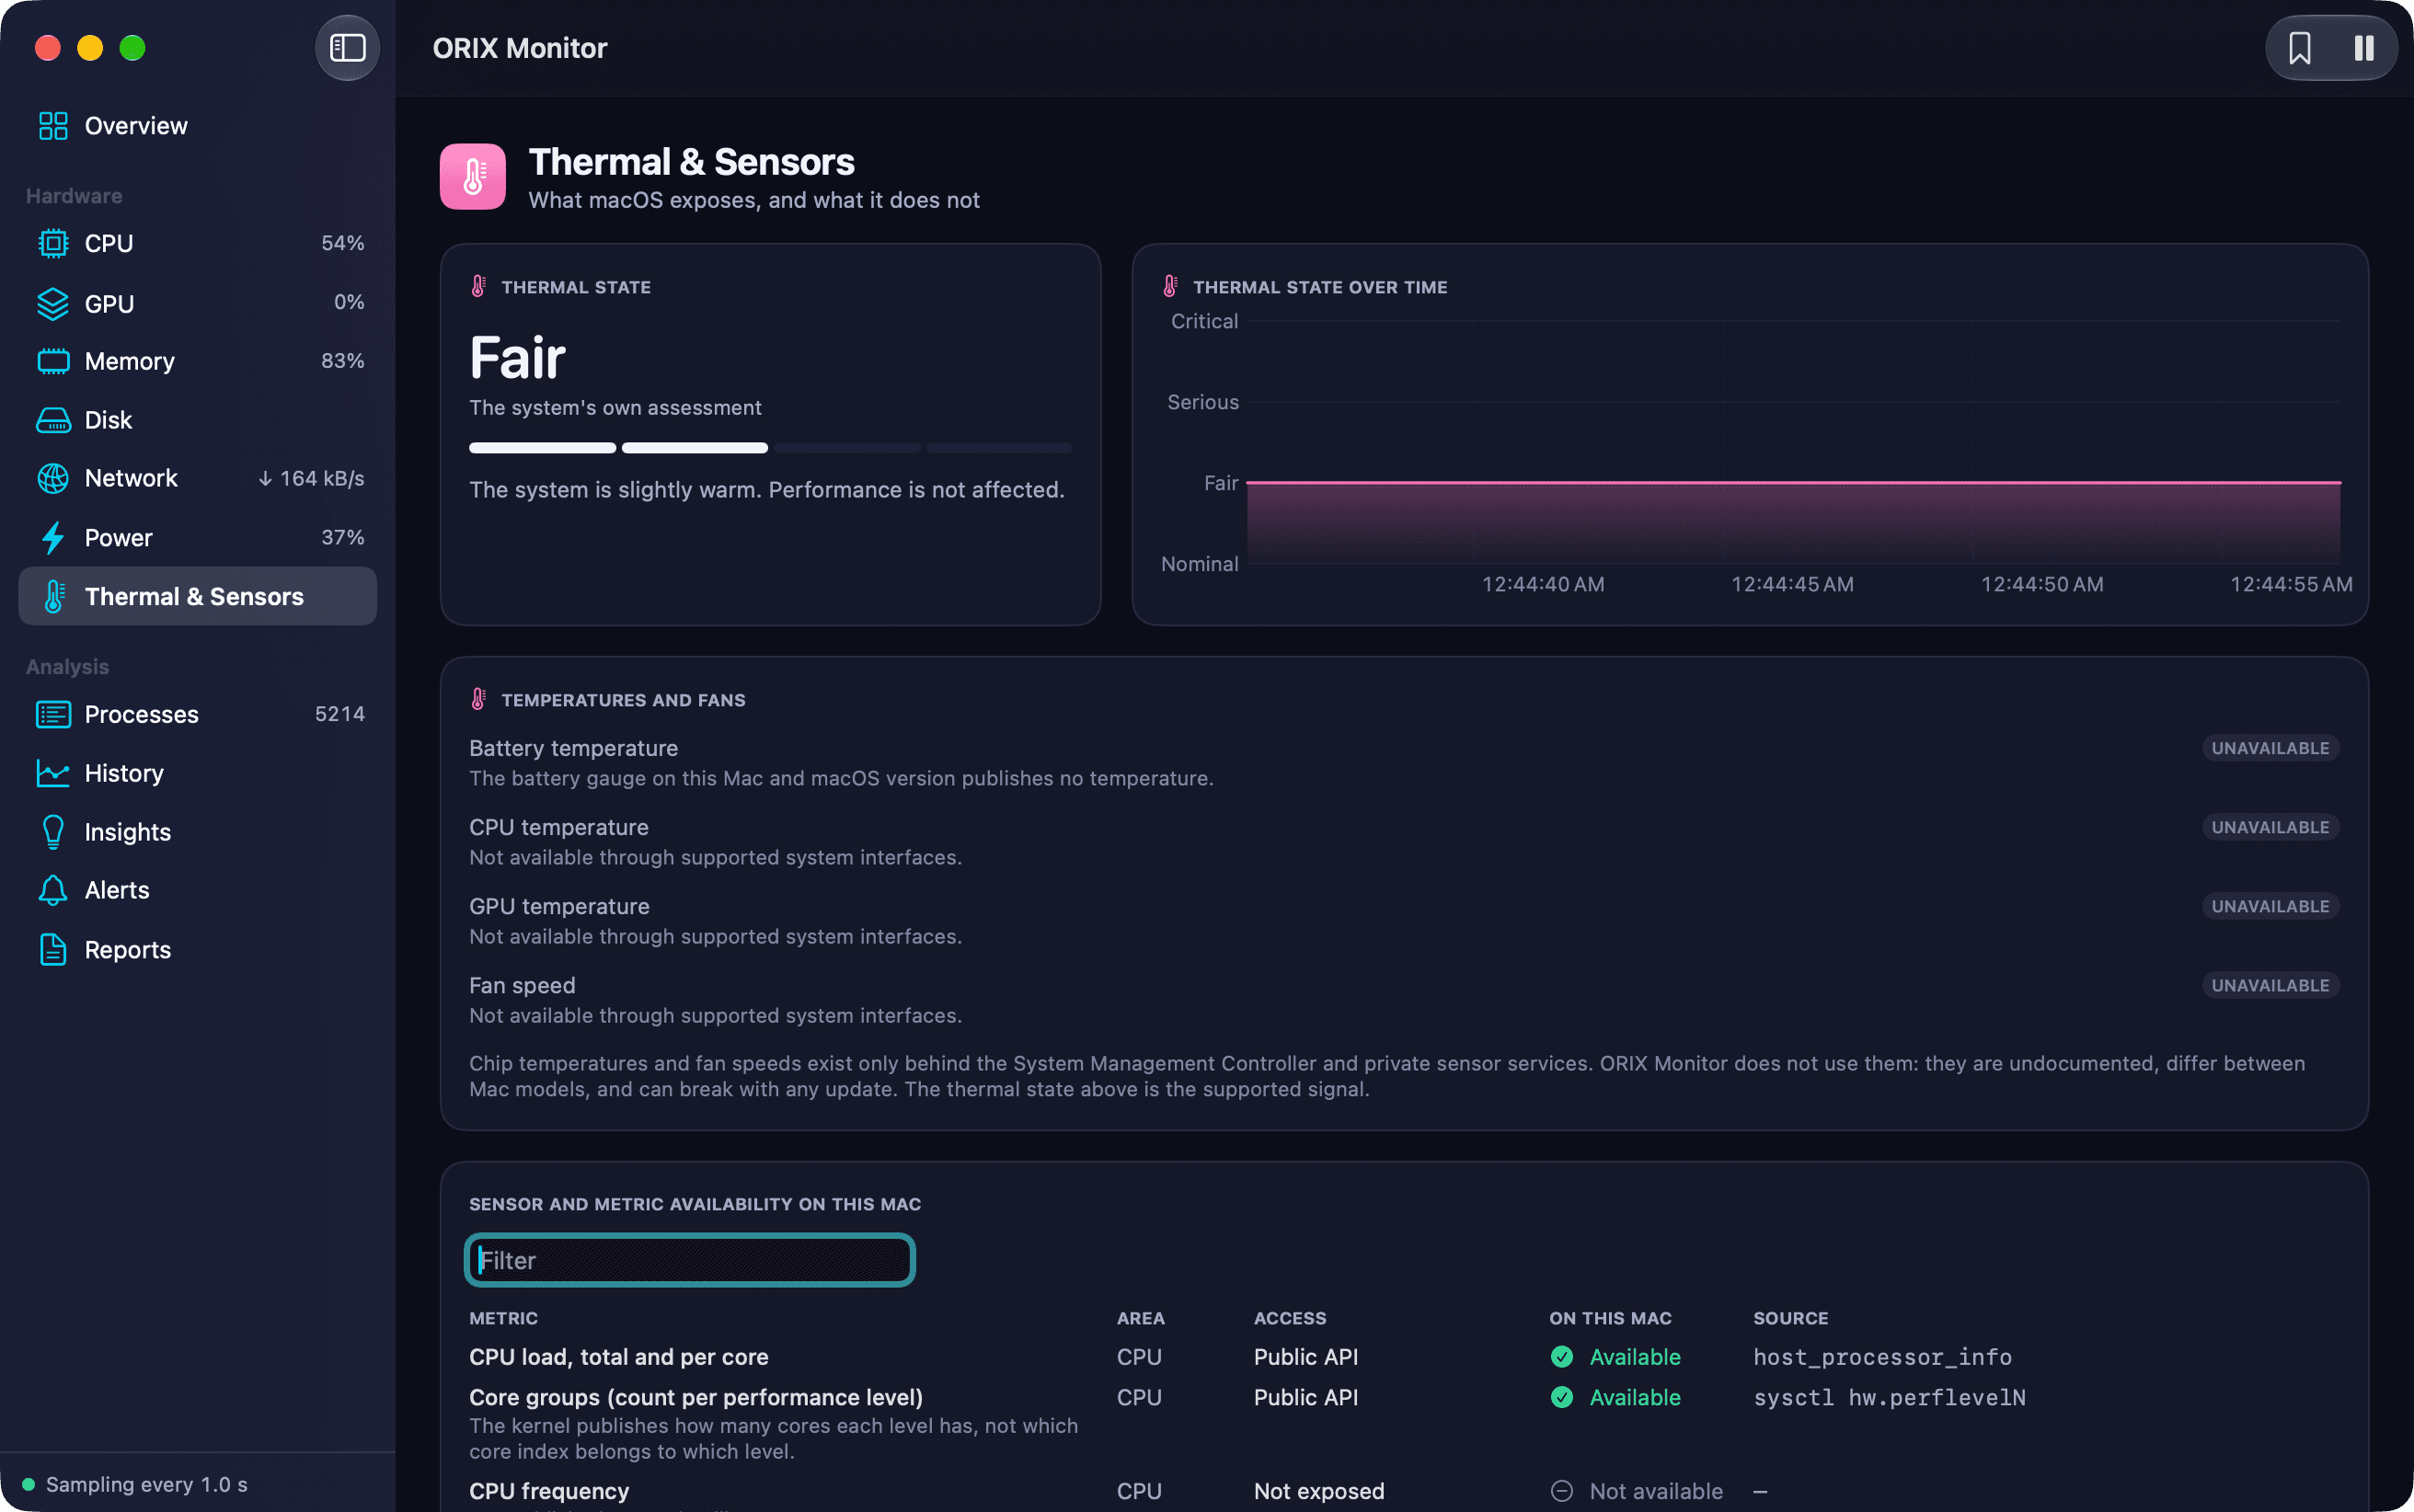
The Thermal & Sensors page lists what macOS exposes on the current Mac and what it does not. Chip temperatures and fan speeds are shown as unavailable because the app does not use private sensor services.
- 04
Local time-series history
Samples are written to a local SQLite store with three retention tiers (raw, per minute, per hour), downsampled queries and gap detection. The History page covers ranges from one hour to one year, with bookmarks and CSV export.
- 05
Customisable overview
The overview is a grid of live widgets that can be reordered by drag and drop, resized and saved as presets.
- 06
Process explorer
A sortable, searchable process table built on libproc, with an inspector showing the live history of the selected process and quit actions that ask for confirmation.
- 07
Threshold alerts
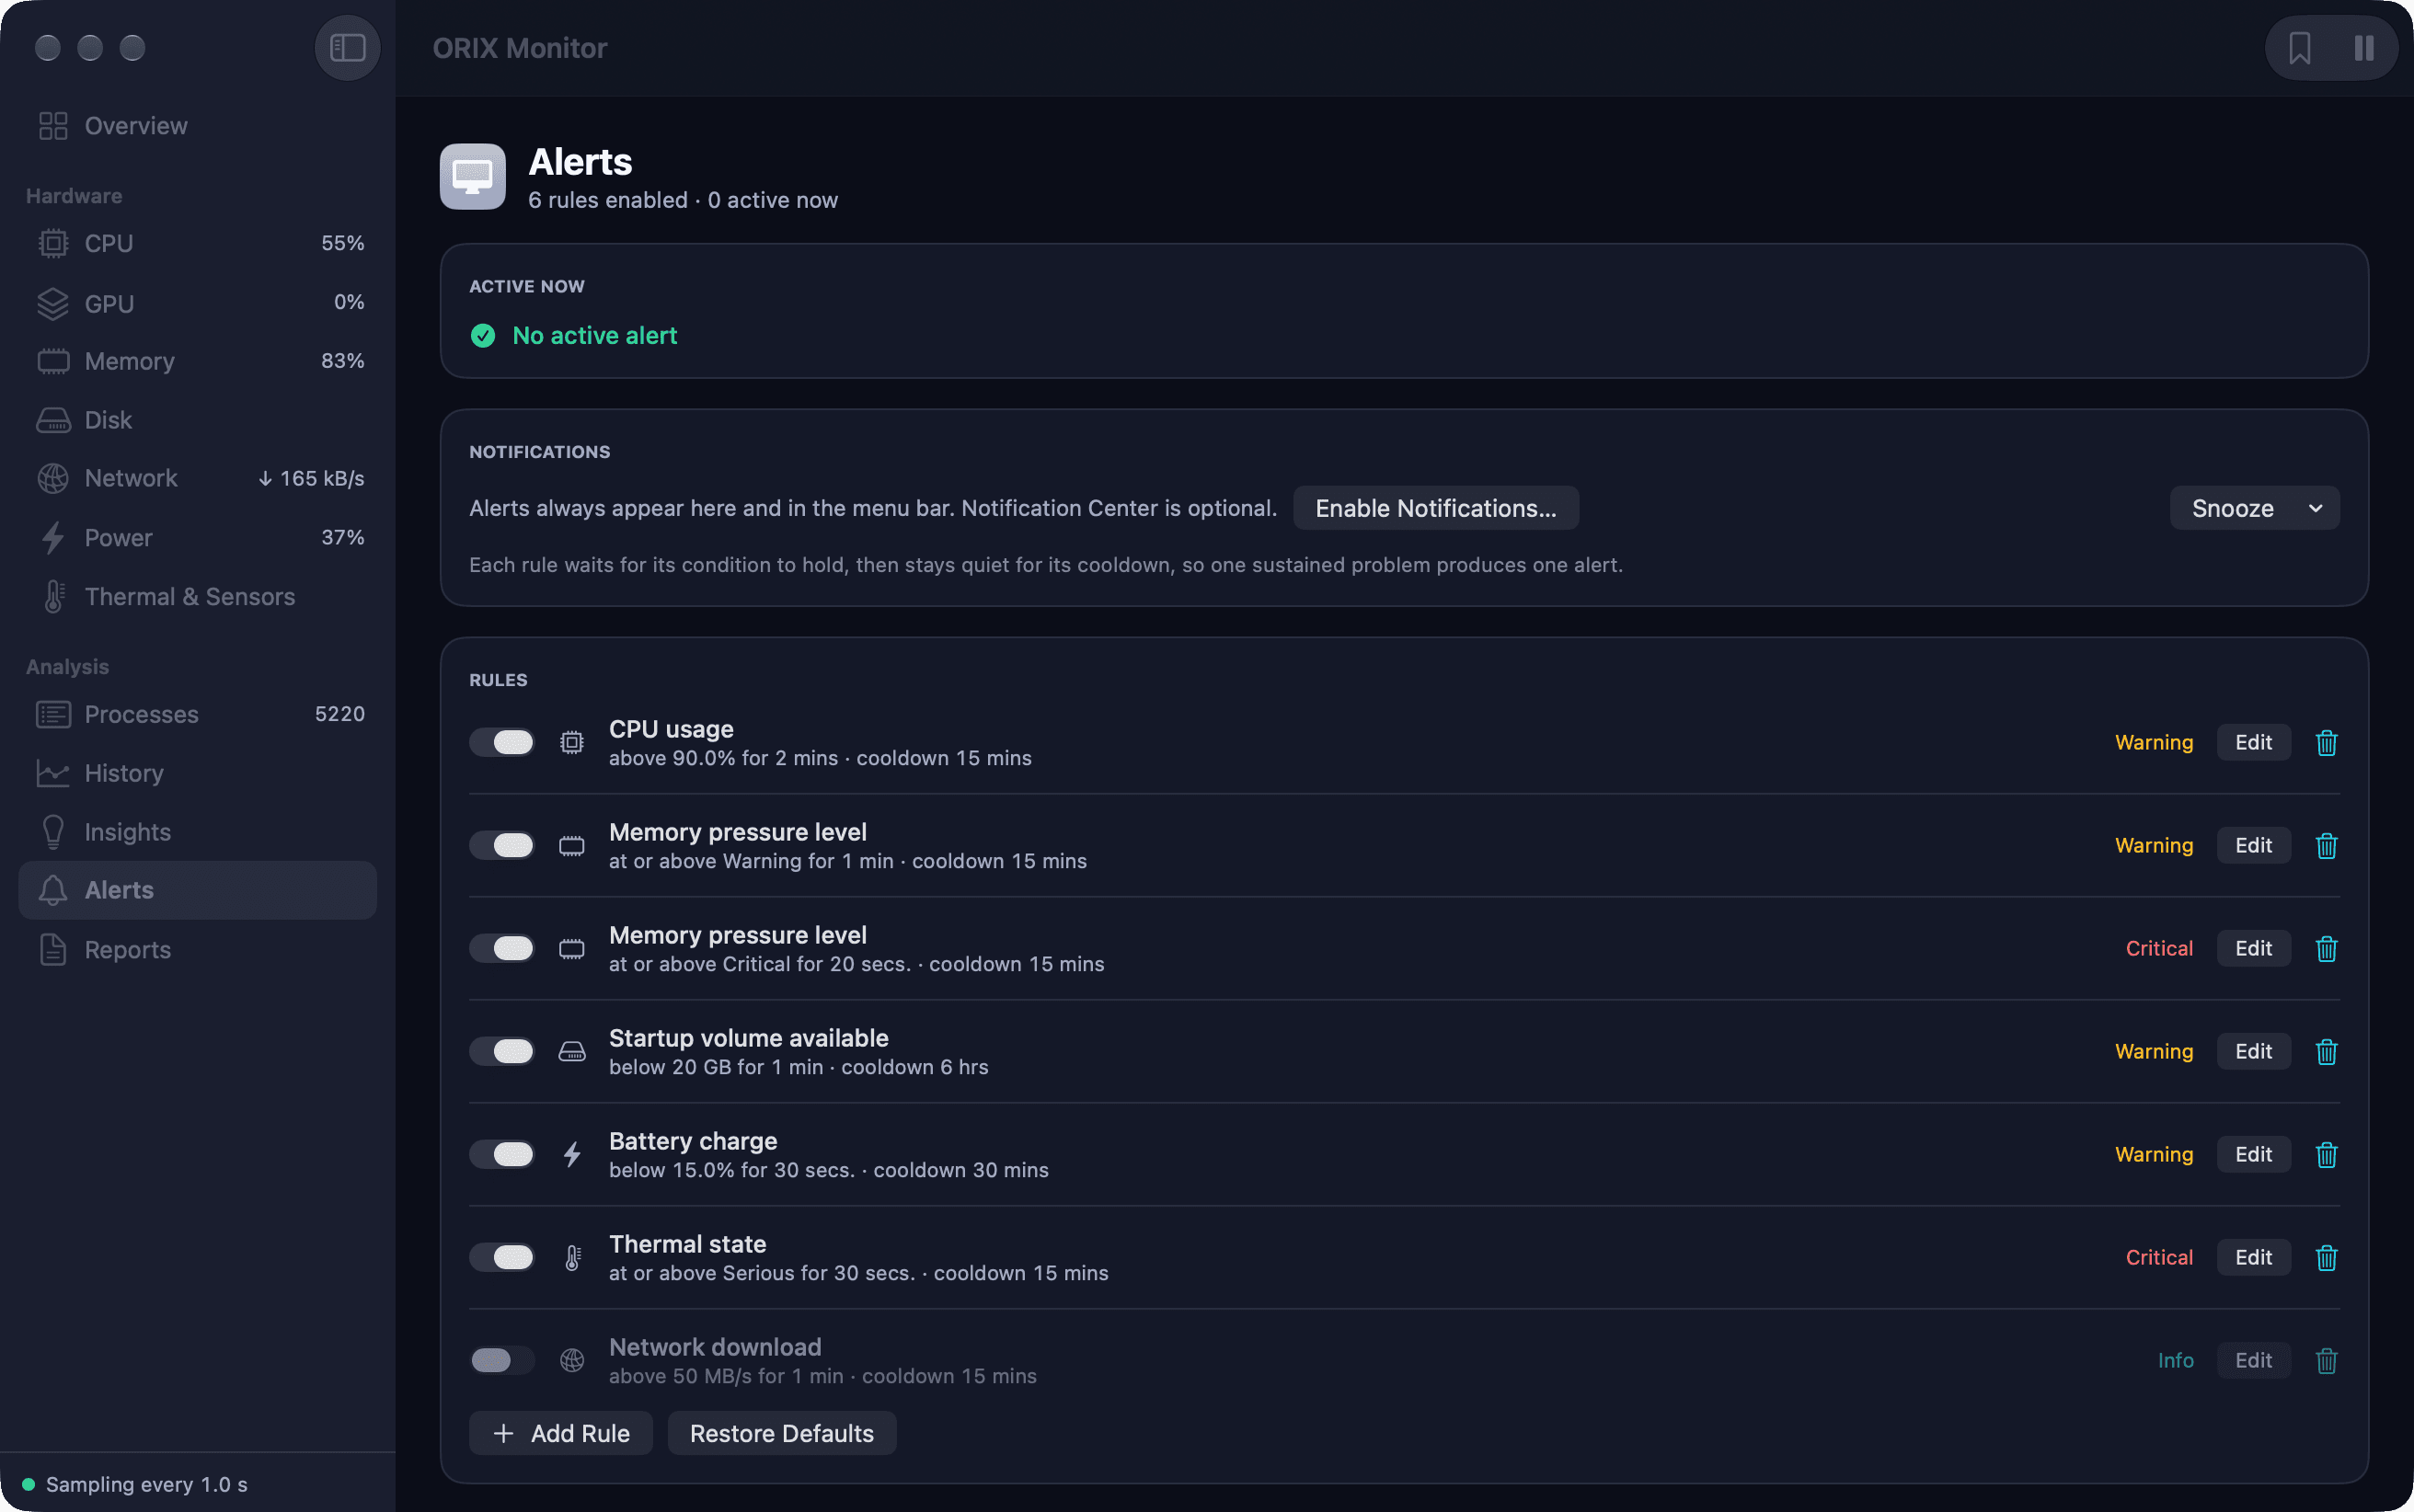
Alert rules combine a threshold, a hold duration and a cooldown, so one sustained problem produces one alert. Alerts can be snoozed; Notification Center is optional.
- 08
Findings backed by numbers
The analysis engine derives findings from stored history, such as sustained CPU usage, memory pressure, swap growth or disk exhaustion, and each one carries the numbers it rests on.
- 09
Reports in four formats
The report builder produces system, CPU, memory, storage, network, process and incident reports from stored samples and exports them as PDF, Markdown, CSV or JSON. Two saved JSON reports can be compared.
Screenshots
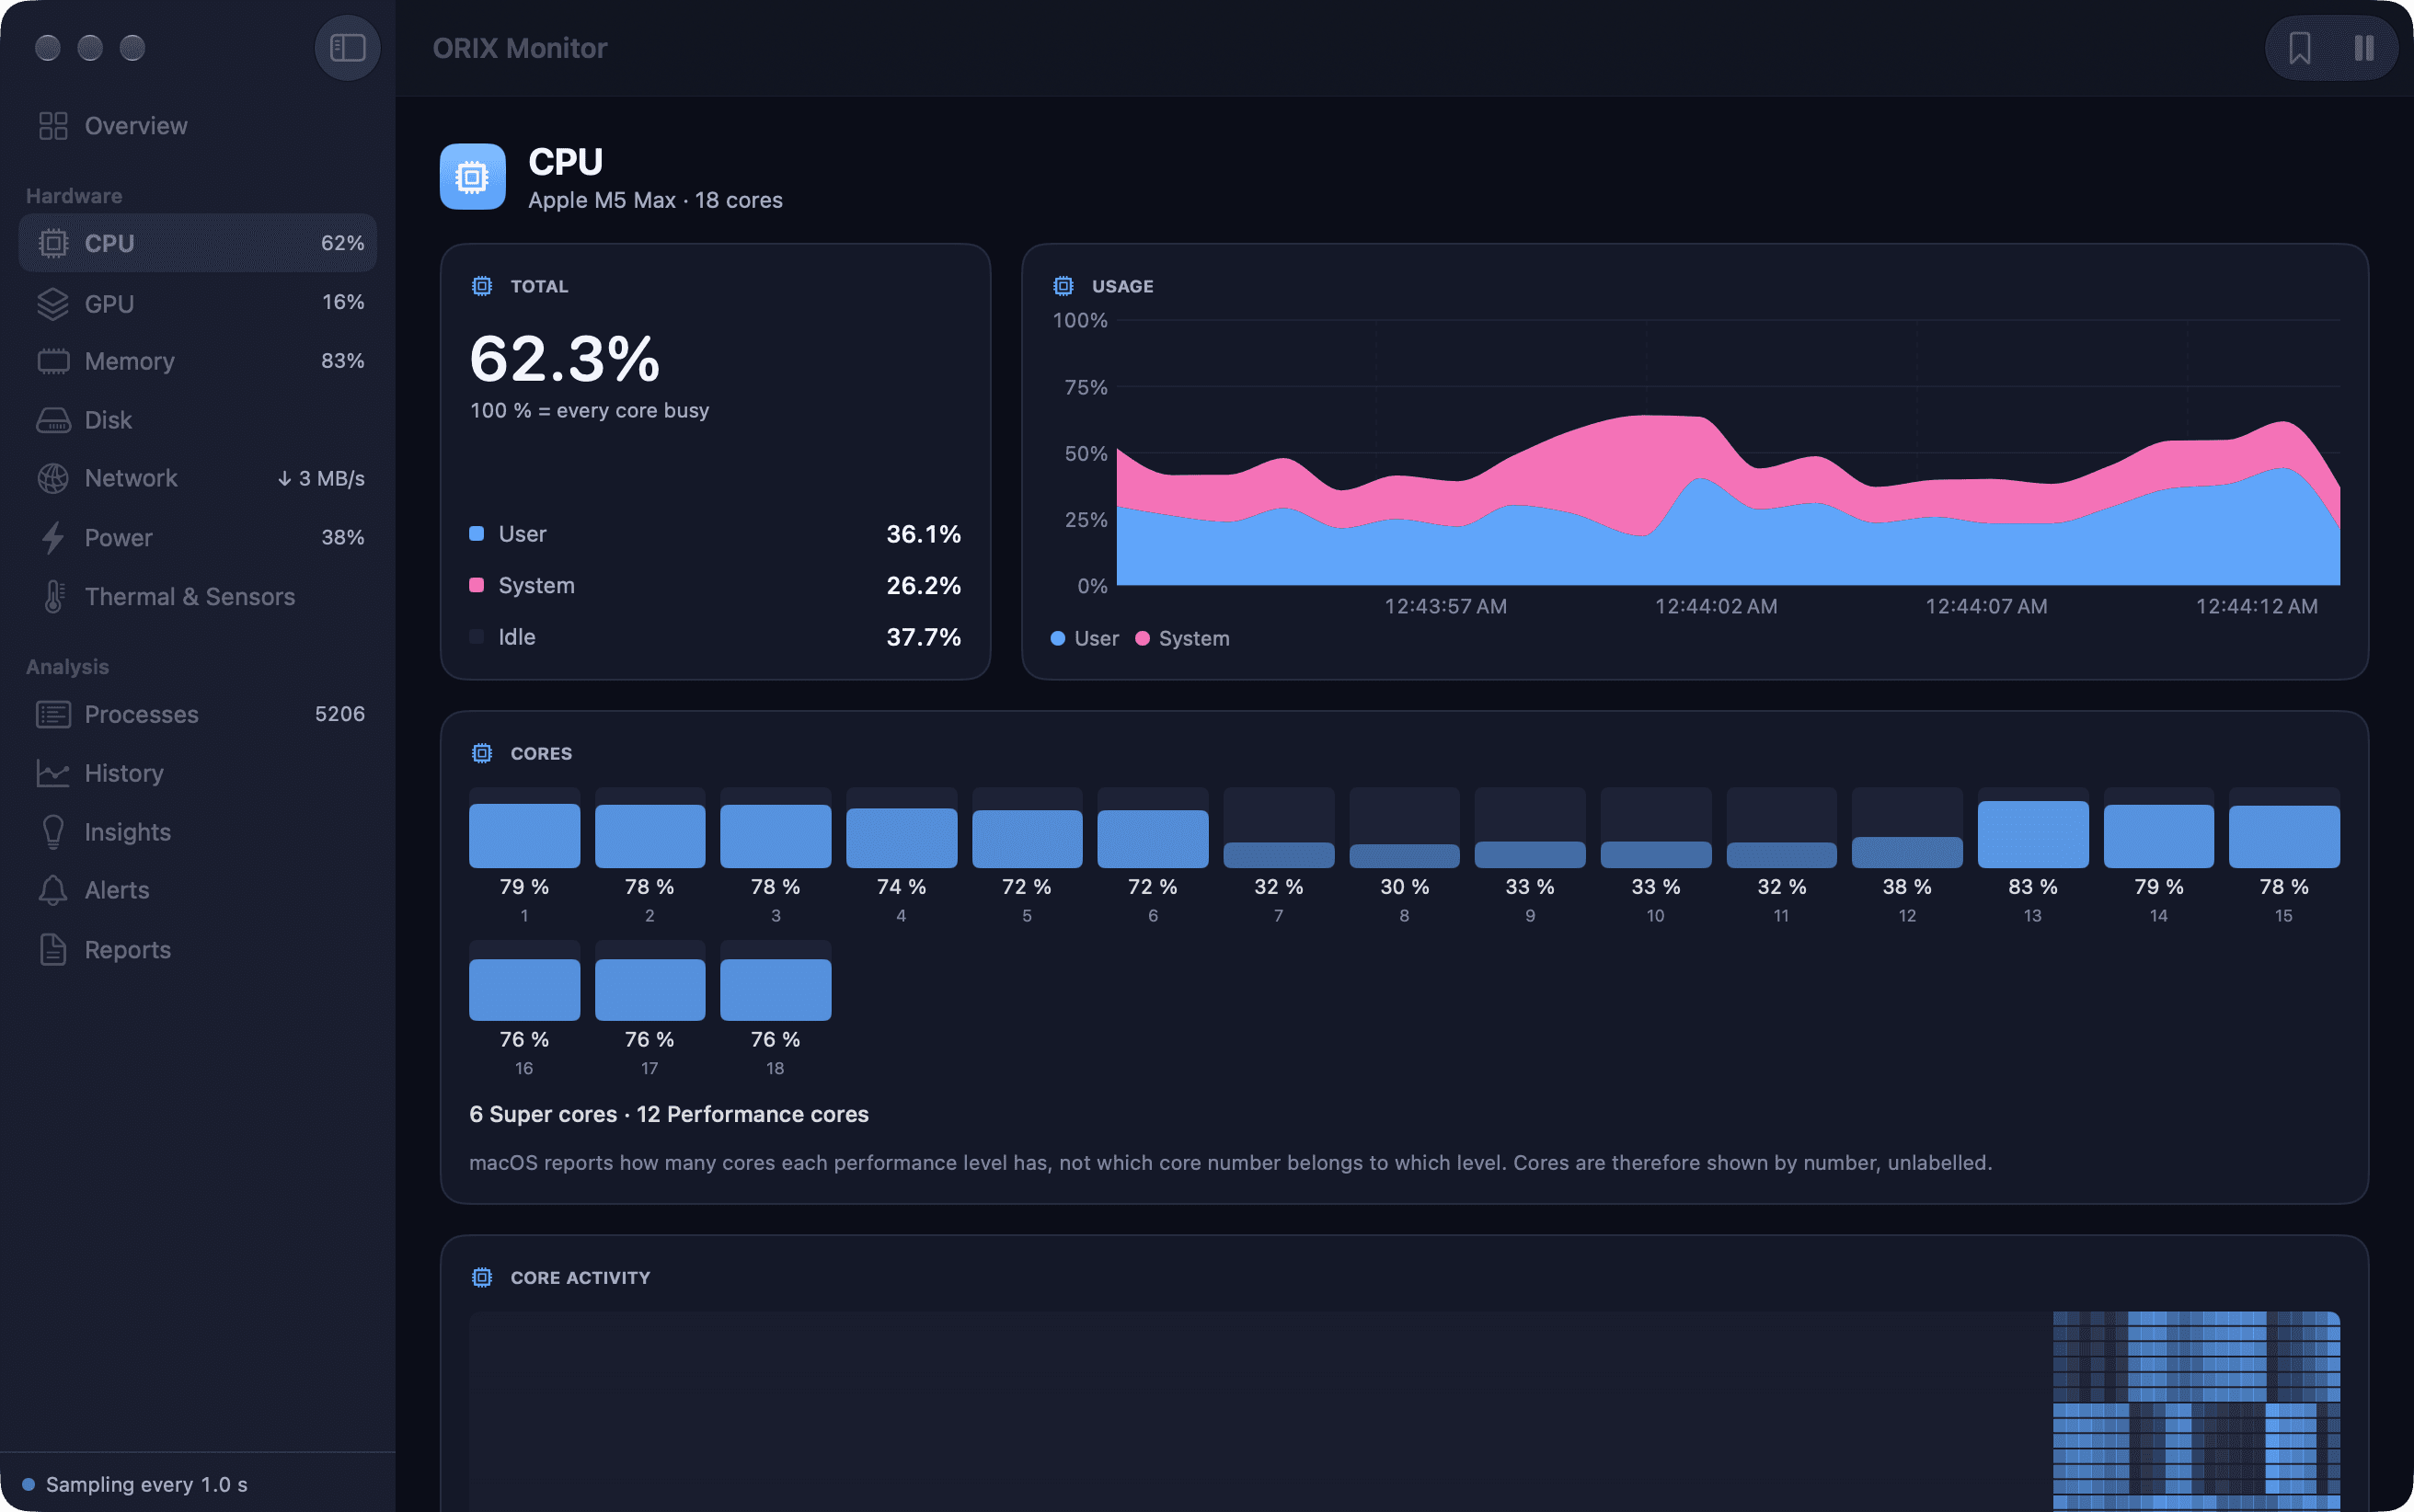
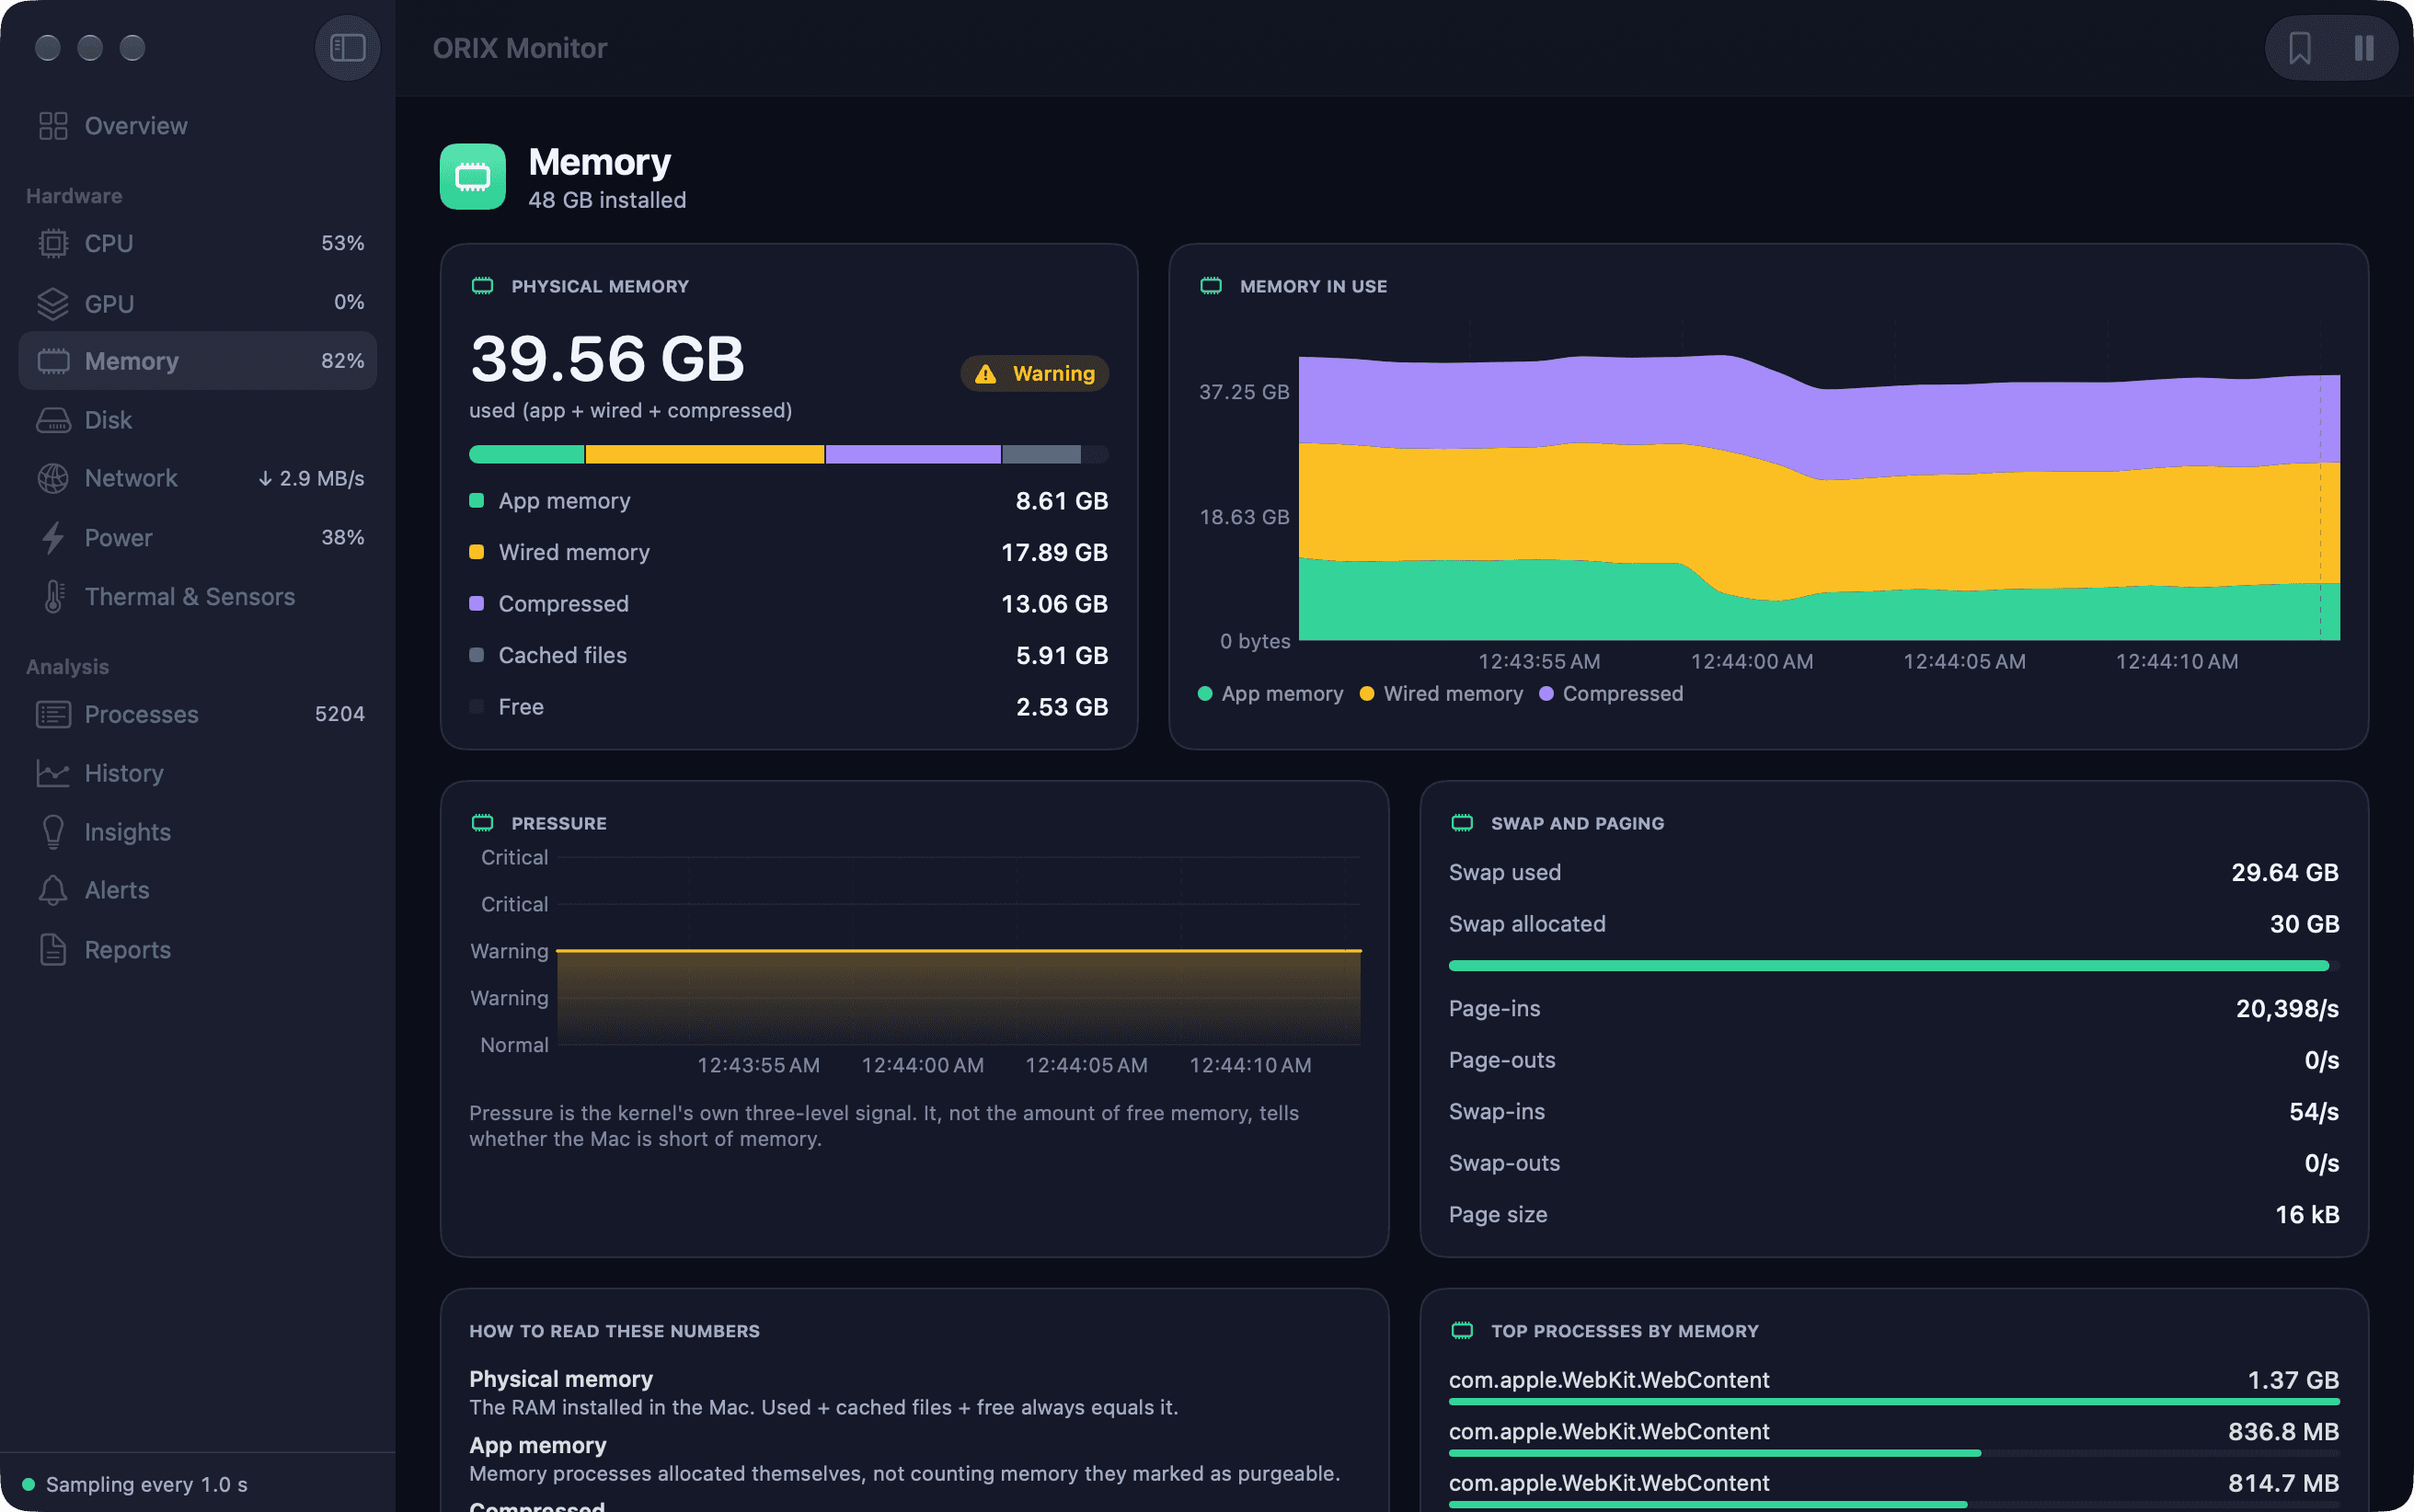
CPU page of a development build: total load, usage over time and per-core activity. Memory page of a development build: breakdown, pressure, swap and paging. Thermal & Sensors page of a development build, with unavailable sensors declared. Alerts page of a development build: rules with hold duration and cooldown.
A closer look
Honest about what macOS exposes
CPU load comes from Mach per-processor tick counters, the process list from libproc, network counters from the kernel's interface list. Where macOS publishes only part of the picture, the app says so: it reports how many cores each performance level has, and shows cores by number because the system does not say which core belongs to which level.
Memory explained, not just counted
The Memory page breaks physical memory into app, wired, compressed and cached, tracks swap and paging rates, and plots the kernel's own three-level pressure signal. A short guide on the page explains how to read each figure.
Thermal state without private sensors
The supported thermal signal is the state reported by macOS, plotted over time. Chip temperatures and fan speeds sit behind undocumented services that differ between Mac models; the app does not read them and marks them unavailable, with a table of every metric's access path on the current Mac.
Alerts designed to stay quiet
Each rule waits for its condition to hold, then stays silent for its cooldown. The alert engine is a pure state machine with no I/O, which is what makes it testable in the core package.
Technical specifications
- Platform
- Mac (macOS)
- Minimum OS
- macOS 15.0
- Architectures
- Not verified yet
- Current version
- Not released
- Release date
- Not released
- Download size
- Not verified yet
- Permissions
- Notifications (optional): alerts always appear in the app and the menu bar; Notification Center is opt-in.
- Offline
- Works entirely on the Mac. According to the app's privacy settings, the only network traffic it creates is the latency test, to a host the user types, when the user presses the button.
- Languages
- English
- Dependencies
- No third-party package. The core uses system interfaces (Mach, libproc, IOKit, DiskArbitration) and SQLite.
- Bundle identifier
- ai.spboucher.orix.monitor
- Source
- Not published
Downloads
macOS disk image
No release yet. Nothing has been signed, notarized or published, and there is no download.
Coming Soon
Not on the App Store yet.
Release history
No release has been recorded yet.
Privacy
Measurements are stored in a local database on the Mac. The app has a privacy mask and reports leave out identifying details by default.
- History is kept in a local SQLite store with configurable retention.
- A privacy mask hides addresses, host names and user names in the interface.
- Reports never contain the serial number, IP addresses or user names; including the host name is off by default.
- The only network traffic is the user-initiated latency test.
Verification status
Not yet validated on a physical device
Unreleased. The only commit (2026-11-21) covers the telemetry core and states 79 tests; the core test files are in the repository. A UI test suite of 13 scenarios exists, and the test log in the build folder records three failing scenarios and an overall failed result. No test was run to prepare this page.
The app, its UI tests and scripts are not committed yet and are still changing. No signed, notarized or packaged build exists. Screenshots come from a local debug build.
Questions
When will it be available?
No date has been announced. The app is unreleased: there is no build to download and no public repository.
Does it show CPU temperature and fan speed?
No. Those values exist only behind undocumented sensor services, which the app does not use. It shows the thermal state reported by macOS and marks the rest as unavailable.
What does “best effort” mean next to a value?
It is one of the quality labels attached to every metric. GPU utilisation, for example, is labelled best effort, and the remaining battery time is labelled an estimate.
Where is the history stored?
In a local SQLite database on the Mac, in three tiers: raw samples, per-minute and per-hour aggregates.
Is it available in French?
Not yet. The interface strings are English only today; the French-Canadian translation is in progress.
More from ORIX
See the full catalog In Development
ORIX Clean
A native macOS storage analyser and cleaner built around a mandatory preview, in development.
MacUtilities- Coming Soon
ORIX Sheet
A native macOS spreadsheet in early development: the calculation engine exists, the app does not yet.
MacProductivity - Coming Soon
ORIX Docs
A native macOS word processor in early development: the document engine exists, the app does not yet.
MacProductivity